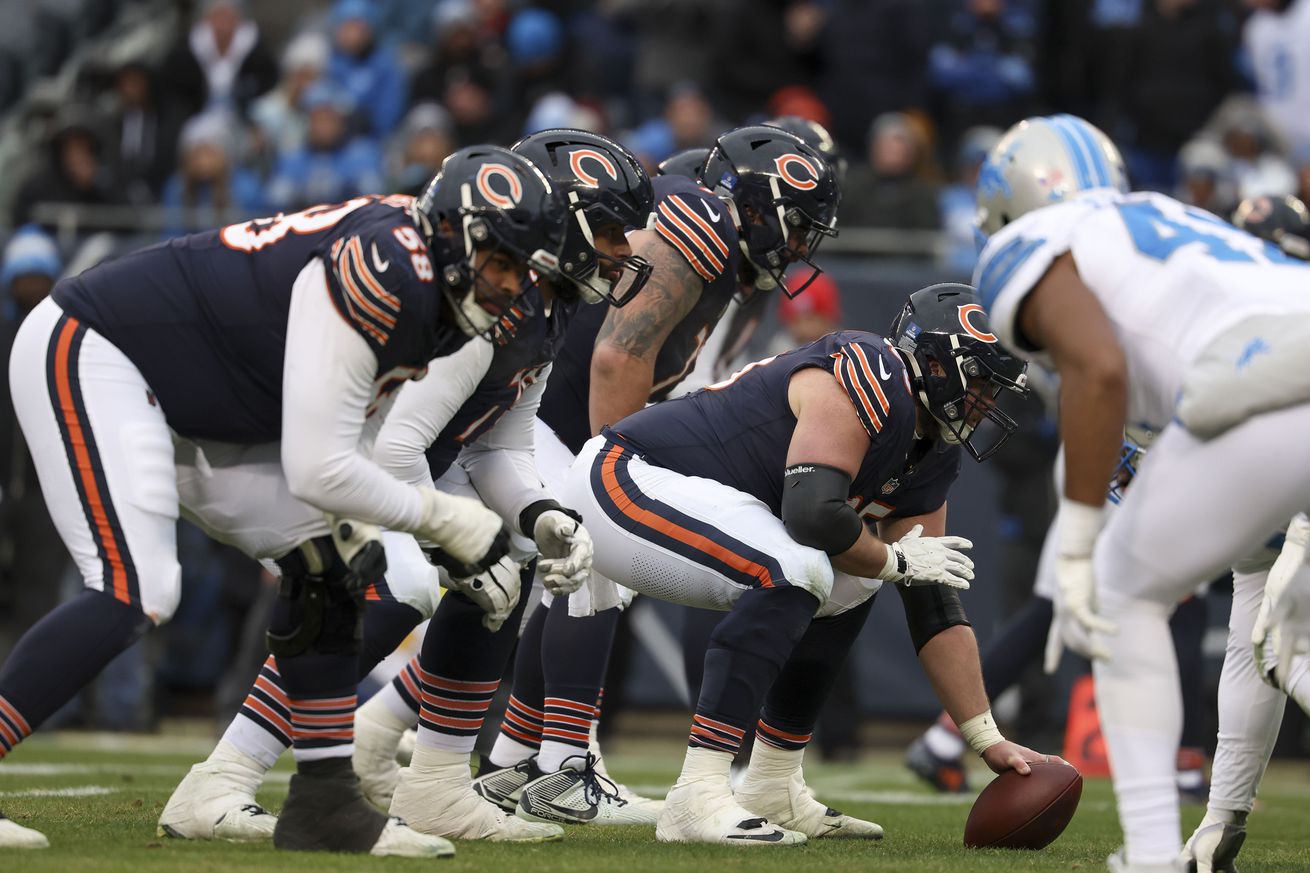
There are a lot of ways to try to measure the performance of an offensive line in football, and none of them should be taken too seriously until fans know what they are looking at.
The Truth is Out There
Most methods available for evaluating offensive lines are, honestly, pretty poor. A small handful of analytic tools do a decent job of isolating pieces of the puzzle, but they are often limited in their scope. Many are nothing more than “black box” metrics, where some sort of magical formula is applied, often mixed with or wholly dependent on the subjective review of raters–essentially, it’s the eye test but with numbers involved.
However, we can do better. I want to believe.
Ultimately, I aimed to find something more objective. I wanted to solve the mystery. And so I founded the FBI: the Fictional Blocking Index.

Photo by FOX Image Collection via Getty Images
The FBI exists to provide a quantifiable answer to which offensive line is the best using only data that is commonly available in public databases. Anyone can crosscheck it. The FBI divides the possible traits of an offensive line into three descriptors. An offensive line can be clutch and imposing or it can be awful.
Clutch: A good offensive line is going to come through in big moments. It’s going to provide the blocking necessary to convert in big moments. It is, in short, clutch. Thus, on the chart below “C” represents the total number 4th-down conversions made and the total number of red zone touchdown passes completed.
Imposing: A good offensive line imposes its will on a defense. It is able to move the line of scrimmage and open lanes for a rushing attack. This, the chart below uses “I” to represent the number of rushing touchdowns a team scores multiplied by the average yards before contact per rushing attempt.
Awful: A bad offensive line, however, sets up its team for failure. Failure is not always the fault of the offensive line, however. The role of a quarterback must be considered. As a result, “A” on the chart represents one half of the total of sacks allowed, false start penalties, and offensive holding penalties. This is a negative value.
The FBI thus turns an offensive line’s performance into these three traits: C.I.A.
Based on this analysis, the best offensive lines in the NFL this season belonged to the Detroit Lions (91.4), the Buffalo Bills (86), and the Philadelphia Eagles (85.3). Honorable mentions should also go to the Baltimore Ravens (74.8) and the Washington Commanders (71.5). The worst offensive lines range from the truly terrible Dallas Cowboys (-3.9) and Tennessee Titans (-3.4) to the merely quite bad Cleveland Browns (1.5), New England Patriots (1.9), and Las Vegas raiders (3). The Chicago Bears (12) are bad, but only just barely in the bottom ten.
Seriously?
Not really. And absolutely. Any vaguely engaged football fan who has been reading this article should have already been thinking of ways to improve the formula. For example, why am I using only aggregate stats for two of the traits but using a rate state for part of the “Imposing” measure? What vetting has been done–if any–on why offensive lines get full credit for red zone touchdowns but take only half of the blame for holding penalties? Why didn’t I consider tackles for a loss?
Those are good questions, and they should be asked. More importantly, they can be asked. Anyone who disagrees with the FBI can challenge it directly and attempt to discredit it. Wait. What I mean is that you don’t have to trust the CIA. No, that seems dangerous to put in writing. Hmmm…What I really mean is this–because everything that went into this measure is public information, it can be reviewed independently. It can be checked for errors. Additionally, because the weighting of each trait is transparent and open, readers can decide for themselves what they think of that weighting and they can make adjustments accordingly.
In this way, the Fictional Blocking Index is both objective and it encourages fans to think for themselves. It does not rely on unthinking trust, unlike other metrics. Is it a good measure? Probably not. However, it measures exactly what it claims to measure, and any desired adjustments are easily made. It is at least partially superior to other metrics because it does not ask you to “trust the experts” but instead invites you to understand the measures you are looking at and take ownership of the data.
For myself, I do somewhat like the simplicity and the intuitiveness of the final scores, and I do stand by the idea that the relative scores probably mean something about the struggles or victories of a given offensive line. I also would guess that the teams with a score above 50 are going to be doing something right up front. It’s not a bad measure, even if it is incomplete.
More than that? Well, unless you know what you’re looking at.
Trust no one.