Here’s how the team stands at midseason, and a look at current pricing trends.
As we head into the weekend and another Cubs homestand, I thought it would be a good time to look at the team’s attendance, which has risen along with their place in the standings. This should not surprise you — teams playing well and with postseason hopes generally draw more people to the ballpark.
The Cubs have played 46 “home” games. I put “home” in quotes because two of those “home” games were at the Tokyo Dome. The Cubs will thus play only 79 games at Wrigley Field this year. Their average attendance per date is officially listed as 36,956, but that includes the two Japan dates. For the 44 Wrigley dates they are averaging 36,718. The first figure ranks sixth in MLB; the second, seventh, slightly behind the Braves at 36,815.
If they maintain that 36,718 average for the remaining 35 home dates (which include a split doubleheader against the Brewers next month), they would add 1,285,130 to the current overall total (including Tokyo) of 1,699,994, which would put them at 2,985,124. Most likely, that average will increase a bit and the Cubs will sell three million tickets for the first time since 2019.
I’ll now turn over the rest of this post to BCBer Lifetime Cubs Fan, who will provide some analysis of upcoming ticket pricing trends. The rest of this post is LCF’s.
The All-Star break was very timely for me as it has allowed me to transition from vacation mode back into baseball mode. Last week at this time I was in Cinque Terre in Italy, soaking up absolute picturesque coastlines and quaint towns with homes tucked into the precipice bursting with a kaleidoscope of colors. I highly recommend for all to visit Cinque Terre/Tuscany if you have the opportunity.
How ‘bout them Cubs! Raise your hand if you had the Cubs at 18 games over .500 at the All-Star break. This year’s team is deep and has “get outta your seat” talent and they are simply a lot of fun to watch. With the team performance and player ability, it should be no surprise that the stands have been packed with fans so far this year. I will break down season to date numbers (attendance and pricing), provide some perspectives, and share some predictions and advice for the remainder of the season.
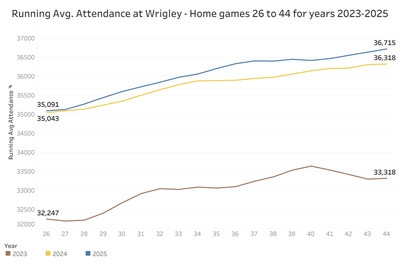
The 36,718 per game average at Wrigley Field is an increase of 1,524 per game since my writeup in May. This is expected as the weather has improved, and the Cubs are in first place. See below for the comparison of running average attendance for home games 26 to 44 for the 2023, 2024 and 2025 seasons. Cubs attendance is up 397 per game, a 1.1 percent increase from last year.
Check out the chart below to see how 2025 attendance numbers are beginning to separate a bit from last year.
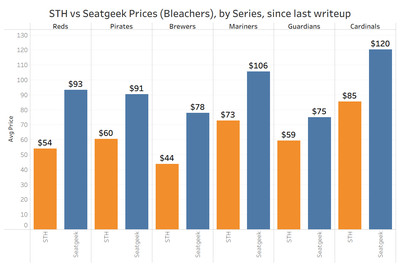
Now, let’s take a look at prices. For those of you new to the attendance/pricing article series, I look at Bleacher ticket prices (Seatgeek vs what STHs paid) as they are the best section for analysis purposes given their general admission nature. The chart below shows, by series since the last writeup, the comparison of what a STH paid vs. what someone paid on Seatgeek 24-48 hrs prior to the game for bleacher tickets (Note: Cardinals tickets as of July 2). It is perfectly clear: ALL series were significantly more expensive on the secondary market vs the STH price. The two series with the highest percentage premiums were the series against the Brewers (77 percent premium) and the series with the Reds (72 percent premium).
Some of you might be thinking the opportunity has passed to see game for a reasonable price from here on out. I’m happy to share there are possibilities to see worthwhile games without completely draining the pocketbook. Below are two series of interest:
Brewers Series – August 18-21 (Five games, all Gold pricing tier)
- On August 18 there’s a split doubleheader. The afternoon game is the rescheduled rainout of the June 18 night game. On Seatgeek, I saw tickets as low as $25 and, in the Home Plate Field Box section, there were four sets of seats cheaper than the STH price of $110 per ticket. I feel these reasonable prices can somewhat be attributed to many ticket holders unable to make the day game now (or maybe they only want to go to the night game)
- For the other four games, there are over 450 total listings for two tickets at $50 or less per ticket. Barring an abysmal record after the All-Star break, or a horrendous weather forecast for all four days of the series, I feel these tickets have a solid probability of spiking significantly between now and the games as these games could have a strong playoff feel to them
Mets Series – September 23-25 (Three games, Silver pricing tier)
- I don’t have a crystal ball, but if someone were to ask me which three-game stretch for the remainder of the season the Cubs are most likely to clinch the division, it would be this series. If a clincher is a possibility, good luck getting any ticket for under $100 at the last minute. As of now, you can get tickets as low as $22 on Cubs.com, or using Seatgeek, you will discover there are over 200 listings per game (for two tickets) priced at $50 or less per ticket. If the game isn’t a clincher, you can still see the Cubs play one of the best teams in the National League that (fingers crossed) is played on an ideal September evening. For perspective, one could get a bleacher ticket for all three games of this series cheaper than one bleacher ticket for this Friday’s or Saturday’s game against the Red Sox.
End of Season Per game Attendance Prediction
For the remaining 35 home games, I am forecasting the Cubs to average 37,696 in paid attendance per game to bring the total attendance for the 79 home games at Wrigley in 2025 to 2,934,820, an average of 37,150 per game. That would represent a 3.4 percent increase in attendance per game compared to 2024. And, like many of you, I am hoping there are some more home games in October. Until then, #RynoStrong and Go Cubs!!